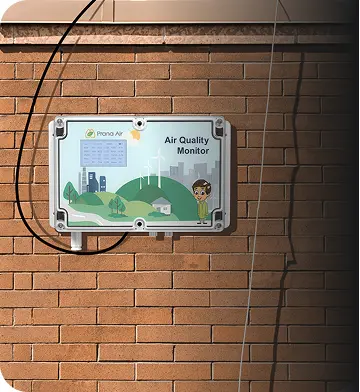
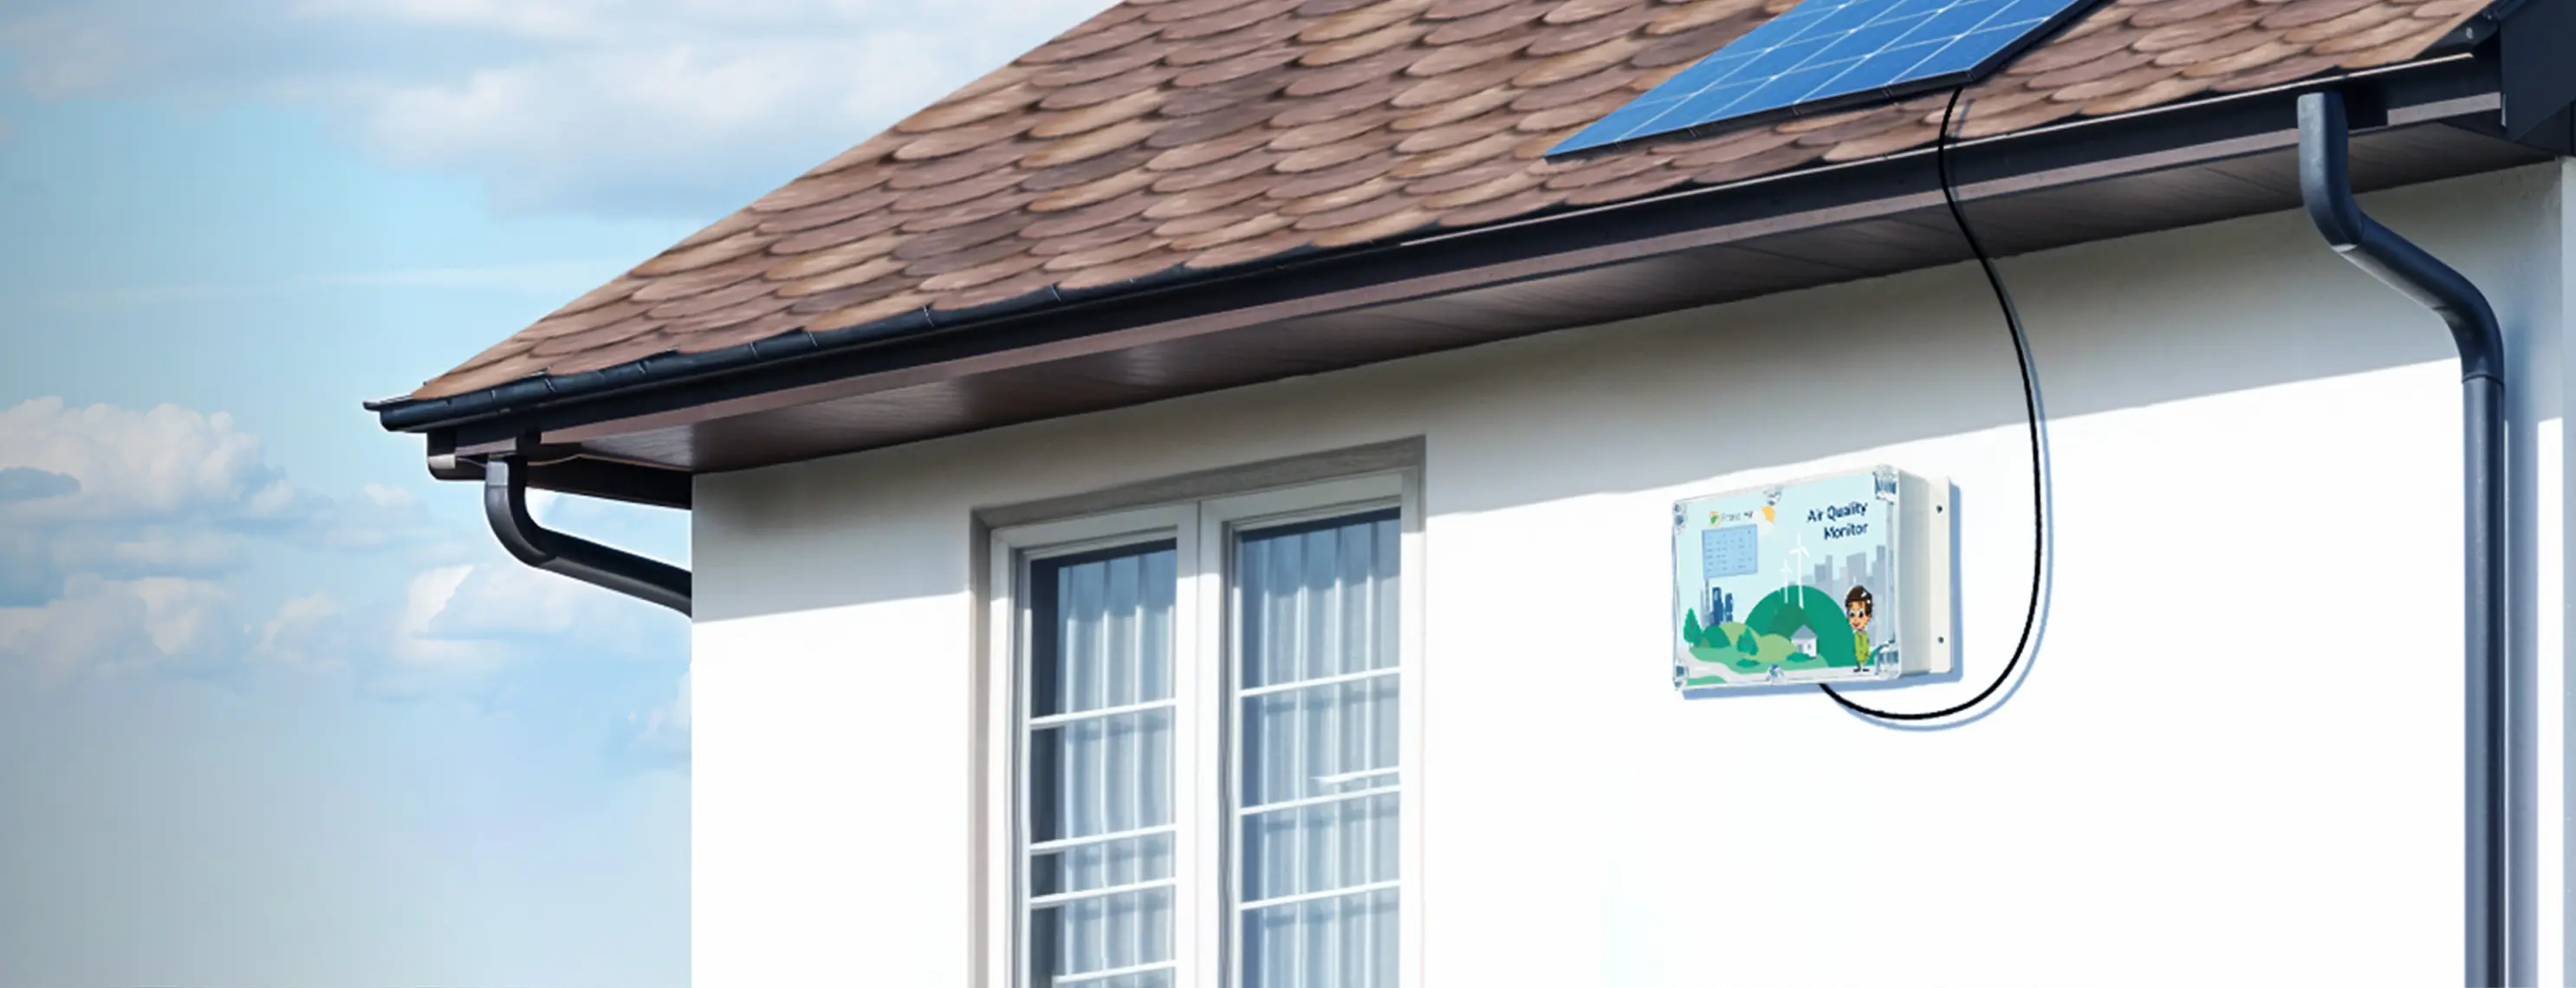
Measure Air Pollution With
Prana Air Smart Air Quality Monitors
Monitor, Analyze, and Control Your Air Quality with Precision Technology.
Contact UsAir Quality Monitoring Devices
For Every Space: Home, Office, & Industrial Use


Low-cost and Highly Reliable Data
Cost-effective solutions without compromising on accuracy, using high-end sensors for measuring.

Remote Data at Your Fingertips
Monitor air quality anytime, anywhere through the AQI mobile app, TV app or web dashboard.
Personalized Air Quality Monitoring
Customized solutions for various industries, offering clear, detailed data views.

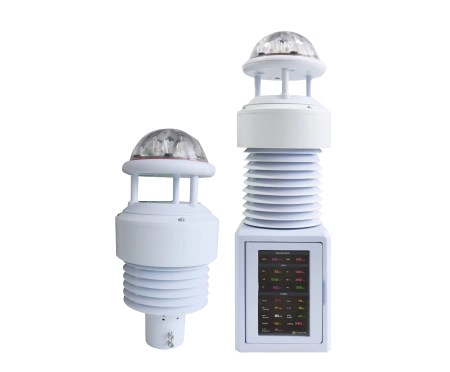
Perfect for every application
Accurate, real-time pollutant tracking with compact, easy-to-use devices.

Versatile Connectivity
Connect via Wi-Fi, GSM, or RS-485 and integrate with BMS for 24/7 real-time monitoring.
How Does An Air Quality Monitoring System Work?

01
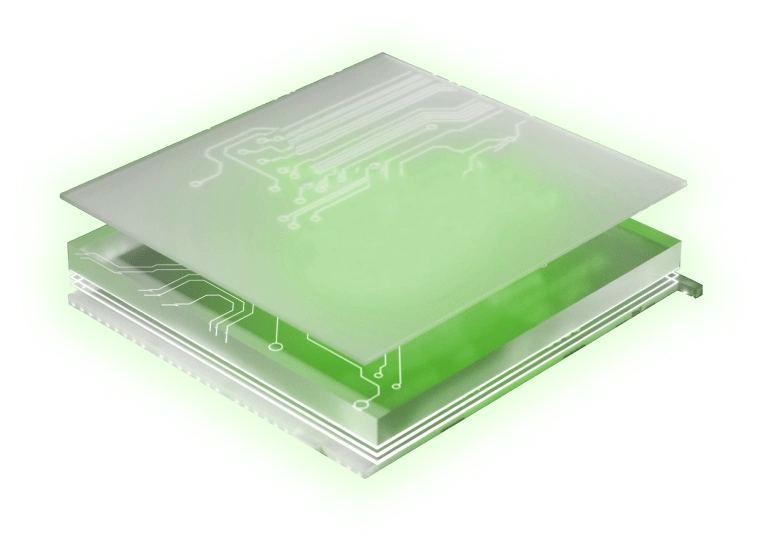
PCB Embedded or Platform
The PCB manages power, processing, and communication. It converts analogue to digital output, supports BMS (Battery Management System), and enables data logging and communication via Wi-Fi, Bluetooth, or LoRa.
02
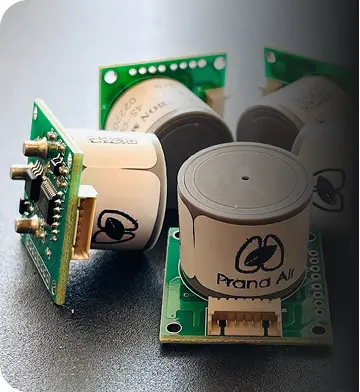
Sensors For Air Quality Detection
Sensors detect pollutants and undergo calibration for accuracy. Automation helps them adjust to factors like temperature and humidity. Bisynking ensures multiple sensors cross-verify data for reliability.
From Sensor to Data:
From Sensor to Data: How Air Quality Monitors Work
03
Housing Protecting the System
The housing ensures proper sampling of air for precise readings. A perfection-oriented design reduces interference. Weatherproofing protects against environmental damage, while a robust structure ensures durability.

04
Dashboard Analyzing and Visualizing Data
The dashboard processes and displays air quality data. The backend (server) handles data storage and processing, while the frontend presents graphs, alerts, and insights for easy monitoring.

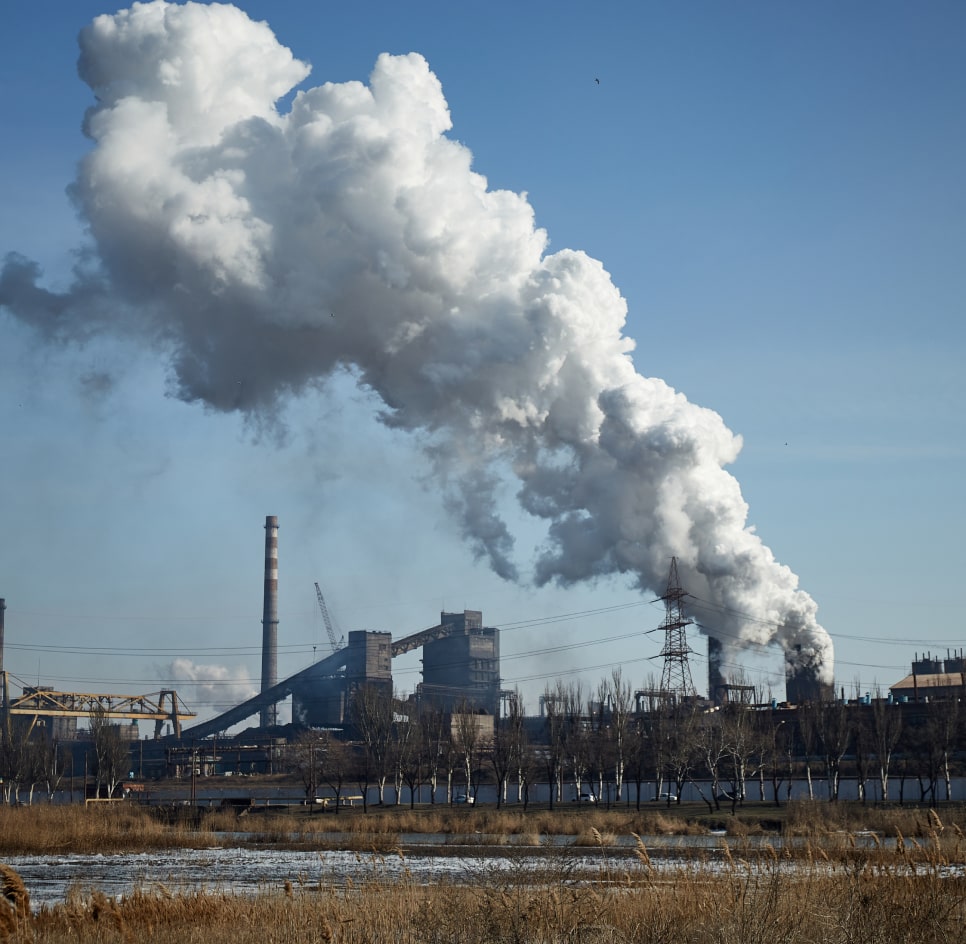
How Air Quality Monitoring Can Reveal the Hidden Impact of Air Pollution?
The harmful substances released into the air are air pollutants that negatively impact the environment and human health.
According to WHO research, nine out of ten people breathe poor air quality, with 99% of the global population exposed to levels exceeding recommended limits. Air pollution causes 8 million deaths each year—3.8 million indoors and 4.2 million outdoors.
The dramatic rise in population has increased energy consumption and resource use. It leads to higher pollutant levels and greater health risks, particularly respiratory illnesses. Therefore, air quality monitoring is crucial. Prana Air's air quality monitors helps in checking pollutants in your environment to make informed decisions for healthier, cleaner air.Explore Solutions
Air Pollutants, Its Sources & the Health Impacts
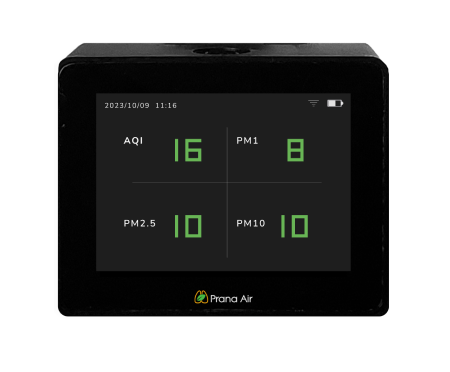
Particulate Matter
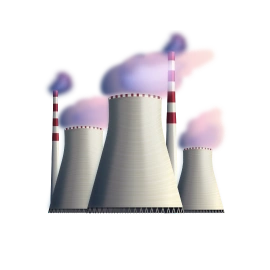
Sources
Indoor sources- cooking, candle burning, tobacco smoking, kerosene heaters, construction activities. Outdoor sources- forest fires, earthquakes, volcanic eruptions, power plants, waste treatment plants, oil refineries, etc.
Health Impact
PM 2.5 diameter is less than 2.5 microns and easily enters the lungs and bloodstream. It causes sneezing, inflammation, skin allergies, asthma, coughing, pneumonia, irregular heartbeat, nonfatal heart attacks, etc. A high PM 2.5 level reduces the visibility. It can also lead to environmental changes as well. PM10 causes allergies that can influence sensitive groups.
Explore More

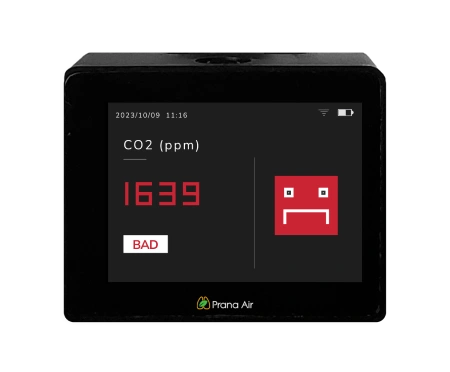
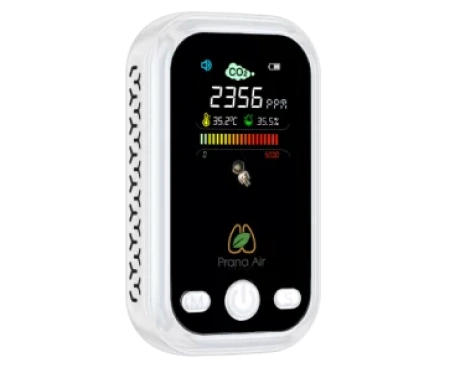
CO2
Sources
The top source of indoor presence of CO2 is humans. As humans inhale oxygen and exhale CO2. It also releases from heating devices, oil-burning coal, and gas burning. CO2 is also emitted because of Deforestation or soil degradation.
Health Impact
High CO2 levels highly influence the individuals performance in a school or office. CO2 exposure can cause headaches, dizziness, restlessness, breathing difficulty, increased heart rate, and other symptoms. CO2 emissions also cause global warming. Long-term exposure can cause extreme health issues. Such as cardiac arrest, and impaired cognitive function.
Explore More

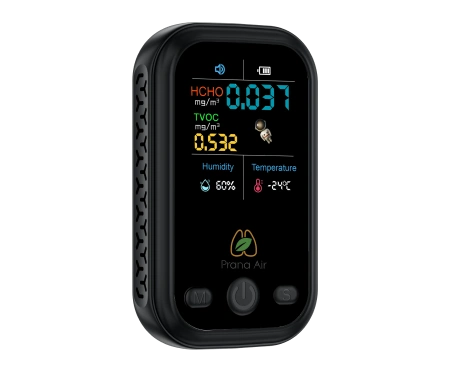
TVOC
Sources
Indoor- Paint, glue, soaps, fabrics, wood, cleansers, plastic products, solvents, etc. TVOCs vaporate at room temperature and release into the air. Outdoor sources of TVOCs are industrial processes, wildfires, and vehicle emissions.
Health Impact
TVOCs evaporate at room temperature. It causes strong odors that cause headaches, fatigue (tiredness), dizziness, nosebleeding, and eye, nose, and throat irritation. High exposure to TVOCs can cause severe health issues. Such as nausea, asthma, and damage to the kidneys, liver, or nervous system. Some chemicals can also cause cancer in animals.
Explore More

HCHO
Sources
Indoor: Smoking, cleaning products, furniture, burning fuel, cosmetics, paint, incense lighting, etc. releases HCHO in the indoor air. Outdoor: HCHO releases from natural gases burning, gasoline, etc.
Health Impact
HCHO exposure can cause extreme health issues. Any individual can face irritation of the eyes, nose, and throat. It can also lead to skin or lung allergies. With it, it increases the chances of some types of cancer and also causes consciousness loss, pneumonia, and other extreme health issues. HCHO exposure can also affect reproductive health.
Explore More
Our Air Quality Monitoring System in the Management!
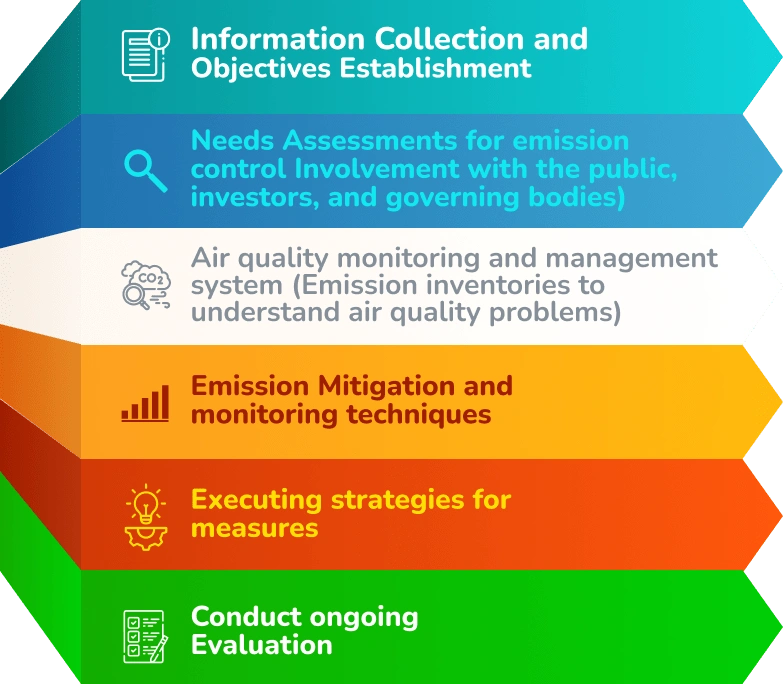
Air Quality Management System is a comprehensive plan to reduce air pollution by tracking root cause of air pollution in different settings. Prana Air's air quality monitors plays a crucial role in each step. As these needed for emission inventories, helping to identify and understand air quality problems. The real-time data from our monitors support effective decision-making for emission control and contribute to the overall assessment of air quality.
Types of Air Quality Monitoring
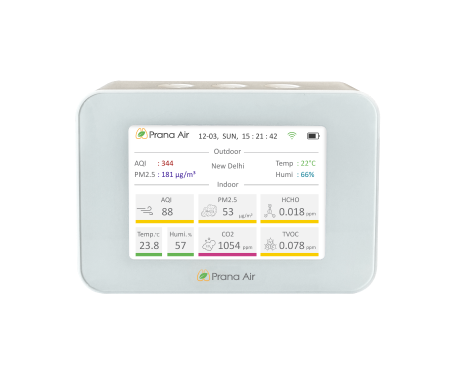
Indoor Air Quality
Indoor air quality (IAQ) refers to the air quality within and around buildings and structures, especially as it relates to the health and comfort of building occupants. Understanding and controlling common pollutants indoors can help reduce your risk of indoor health concerns.
Indoor air can be 2-5 times more polluted than outdoor air. Poor indoor air quality has been linked to a range of health issues, from minor discomfort to serious respiratory conditions.
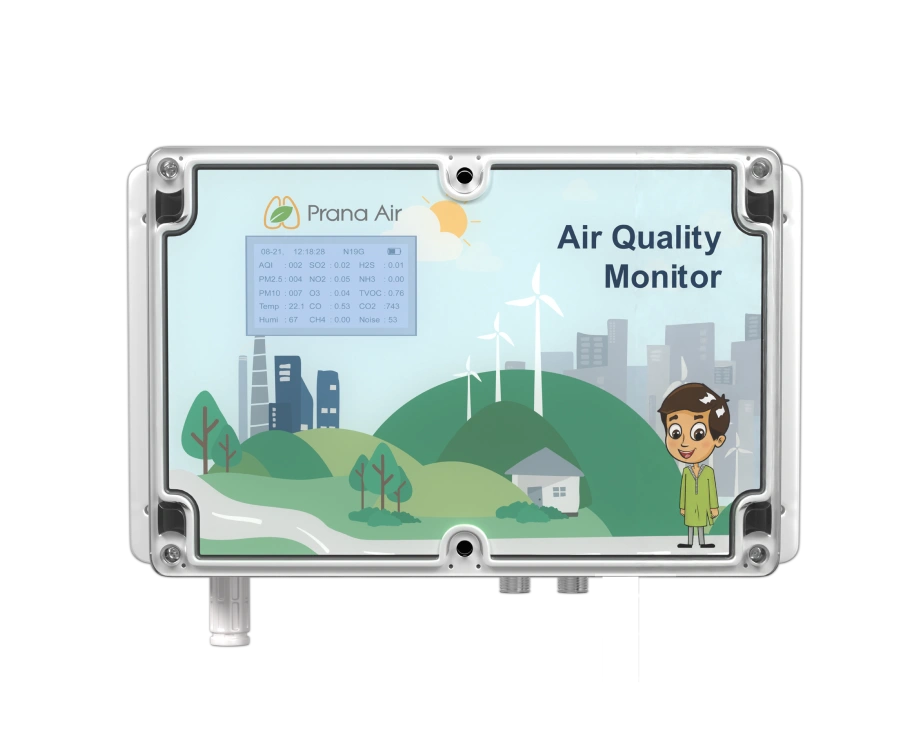
Outdoor Air Quality
Outdoor air quality refers to the condition of the air in the open environment. It is affected by a variety of factors including industrial emissions, vehicle exhaust, weather conditions, wildfires, and other natural and human activities.
Poor outdoor air quality can have significant impacts on human health, particularly for vulnerable populations such as children, the elderly, and those with pre-existing respiratory or cardiovascular conditions.
Connect your AQI Monitors  with Various
  Platforms
One-Stop Solution
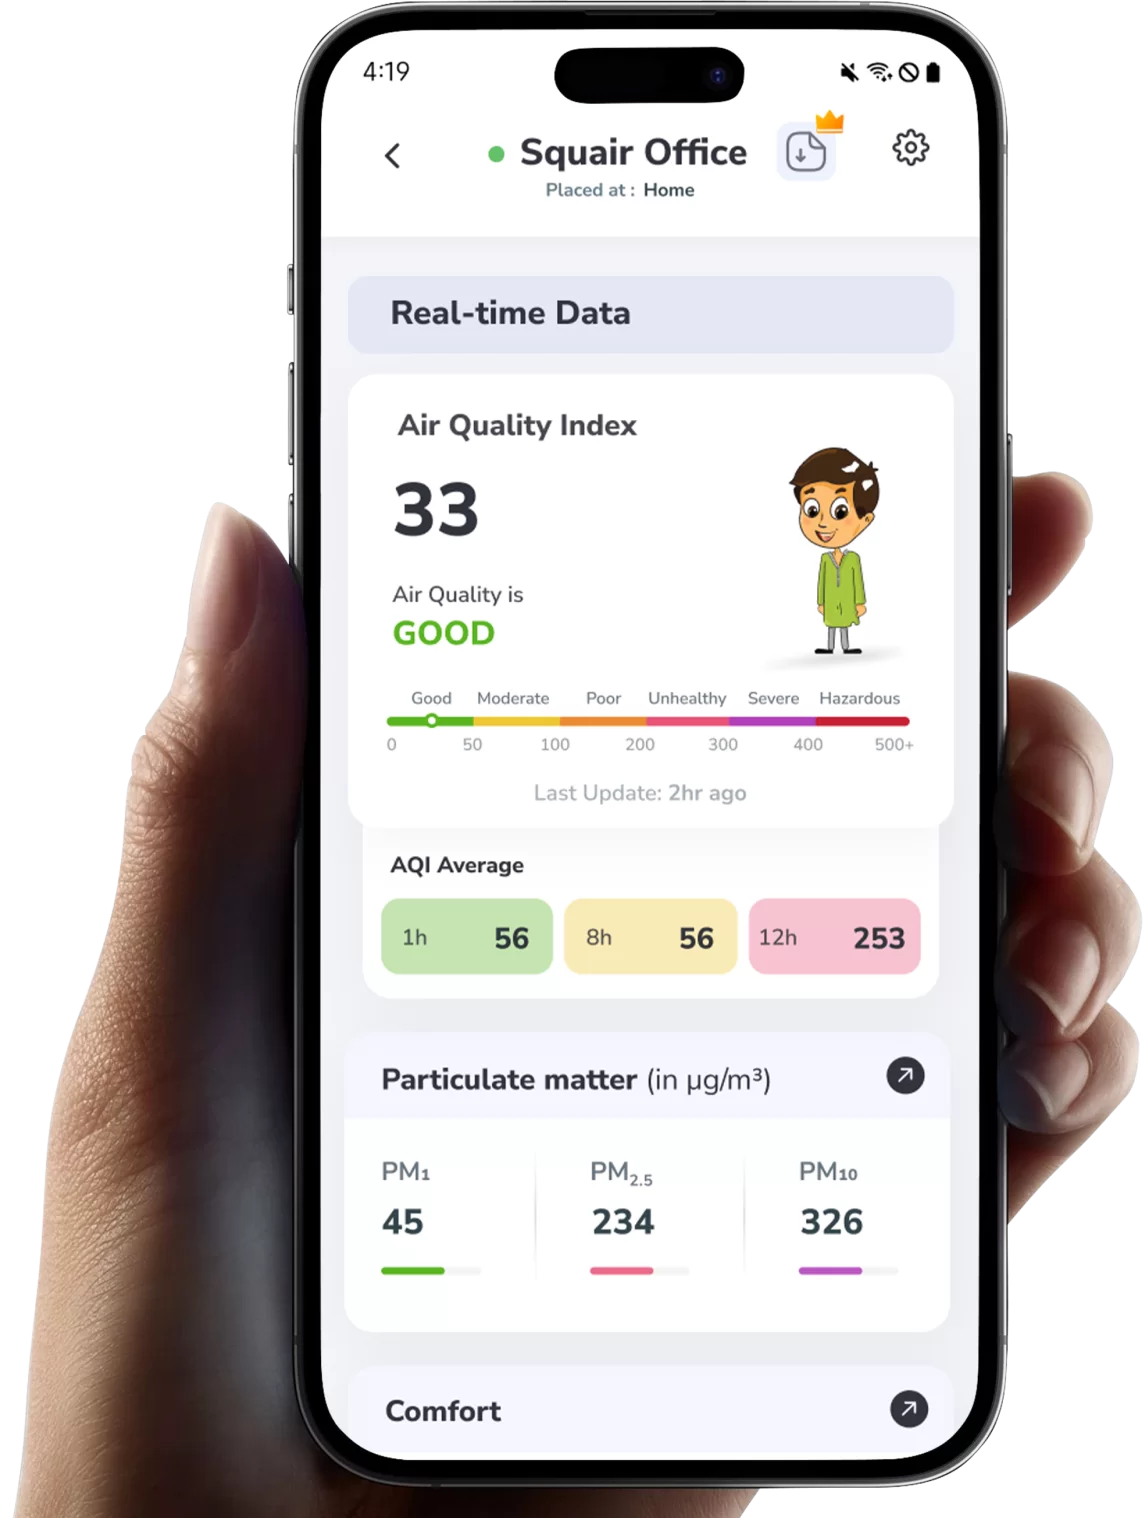
Mobile App

Get health advices
Take some precautions about what to do and not to do when the air quality is good and bad.

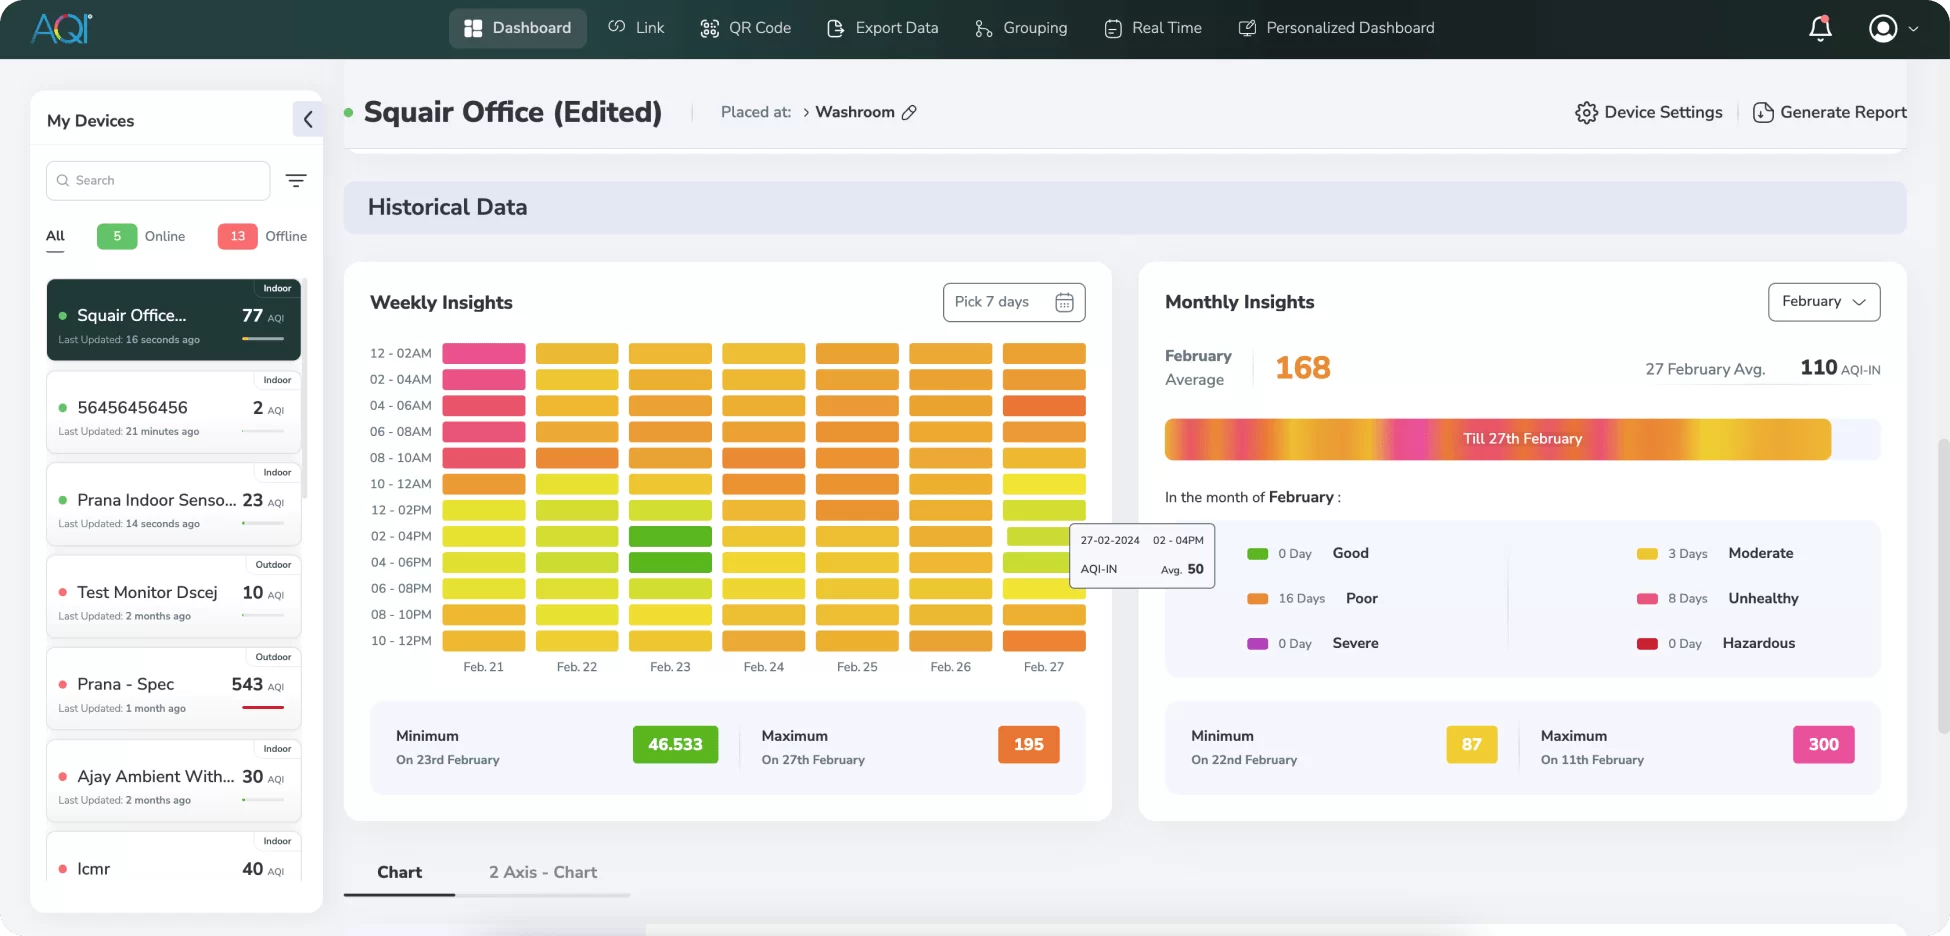
Real-time and historic data access
Access real-time and historic air quality data (24 hours, week, or months) via AQI app.
One-Stop Solution
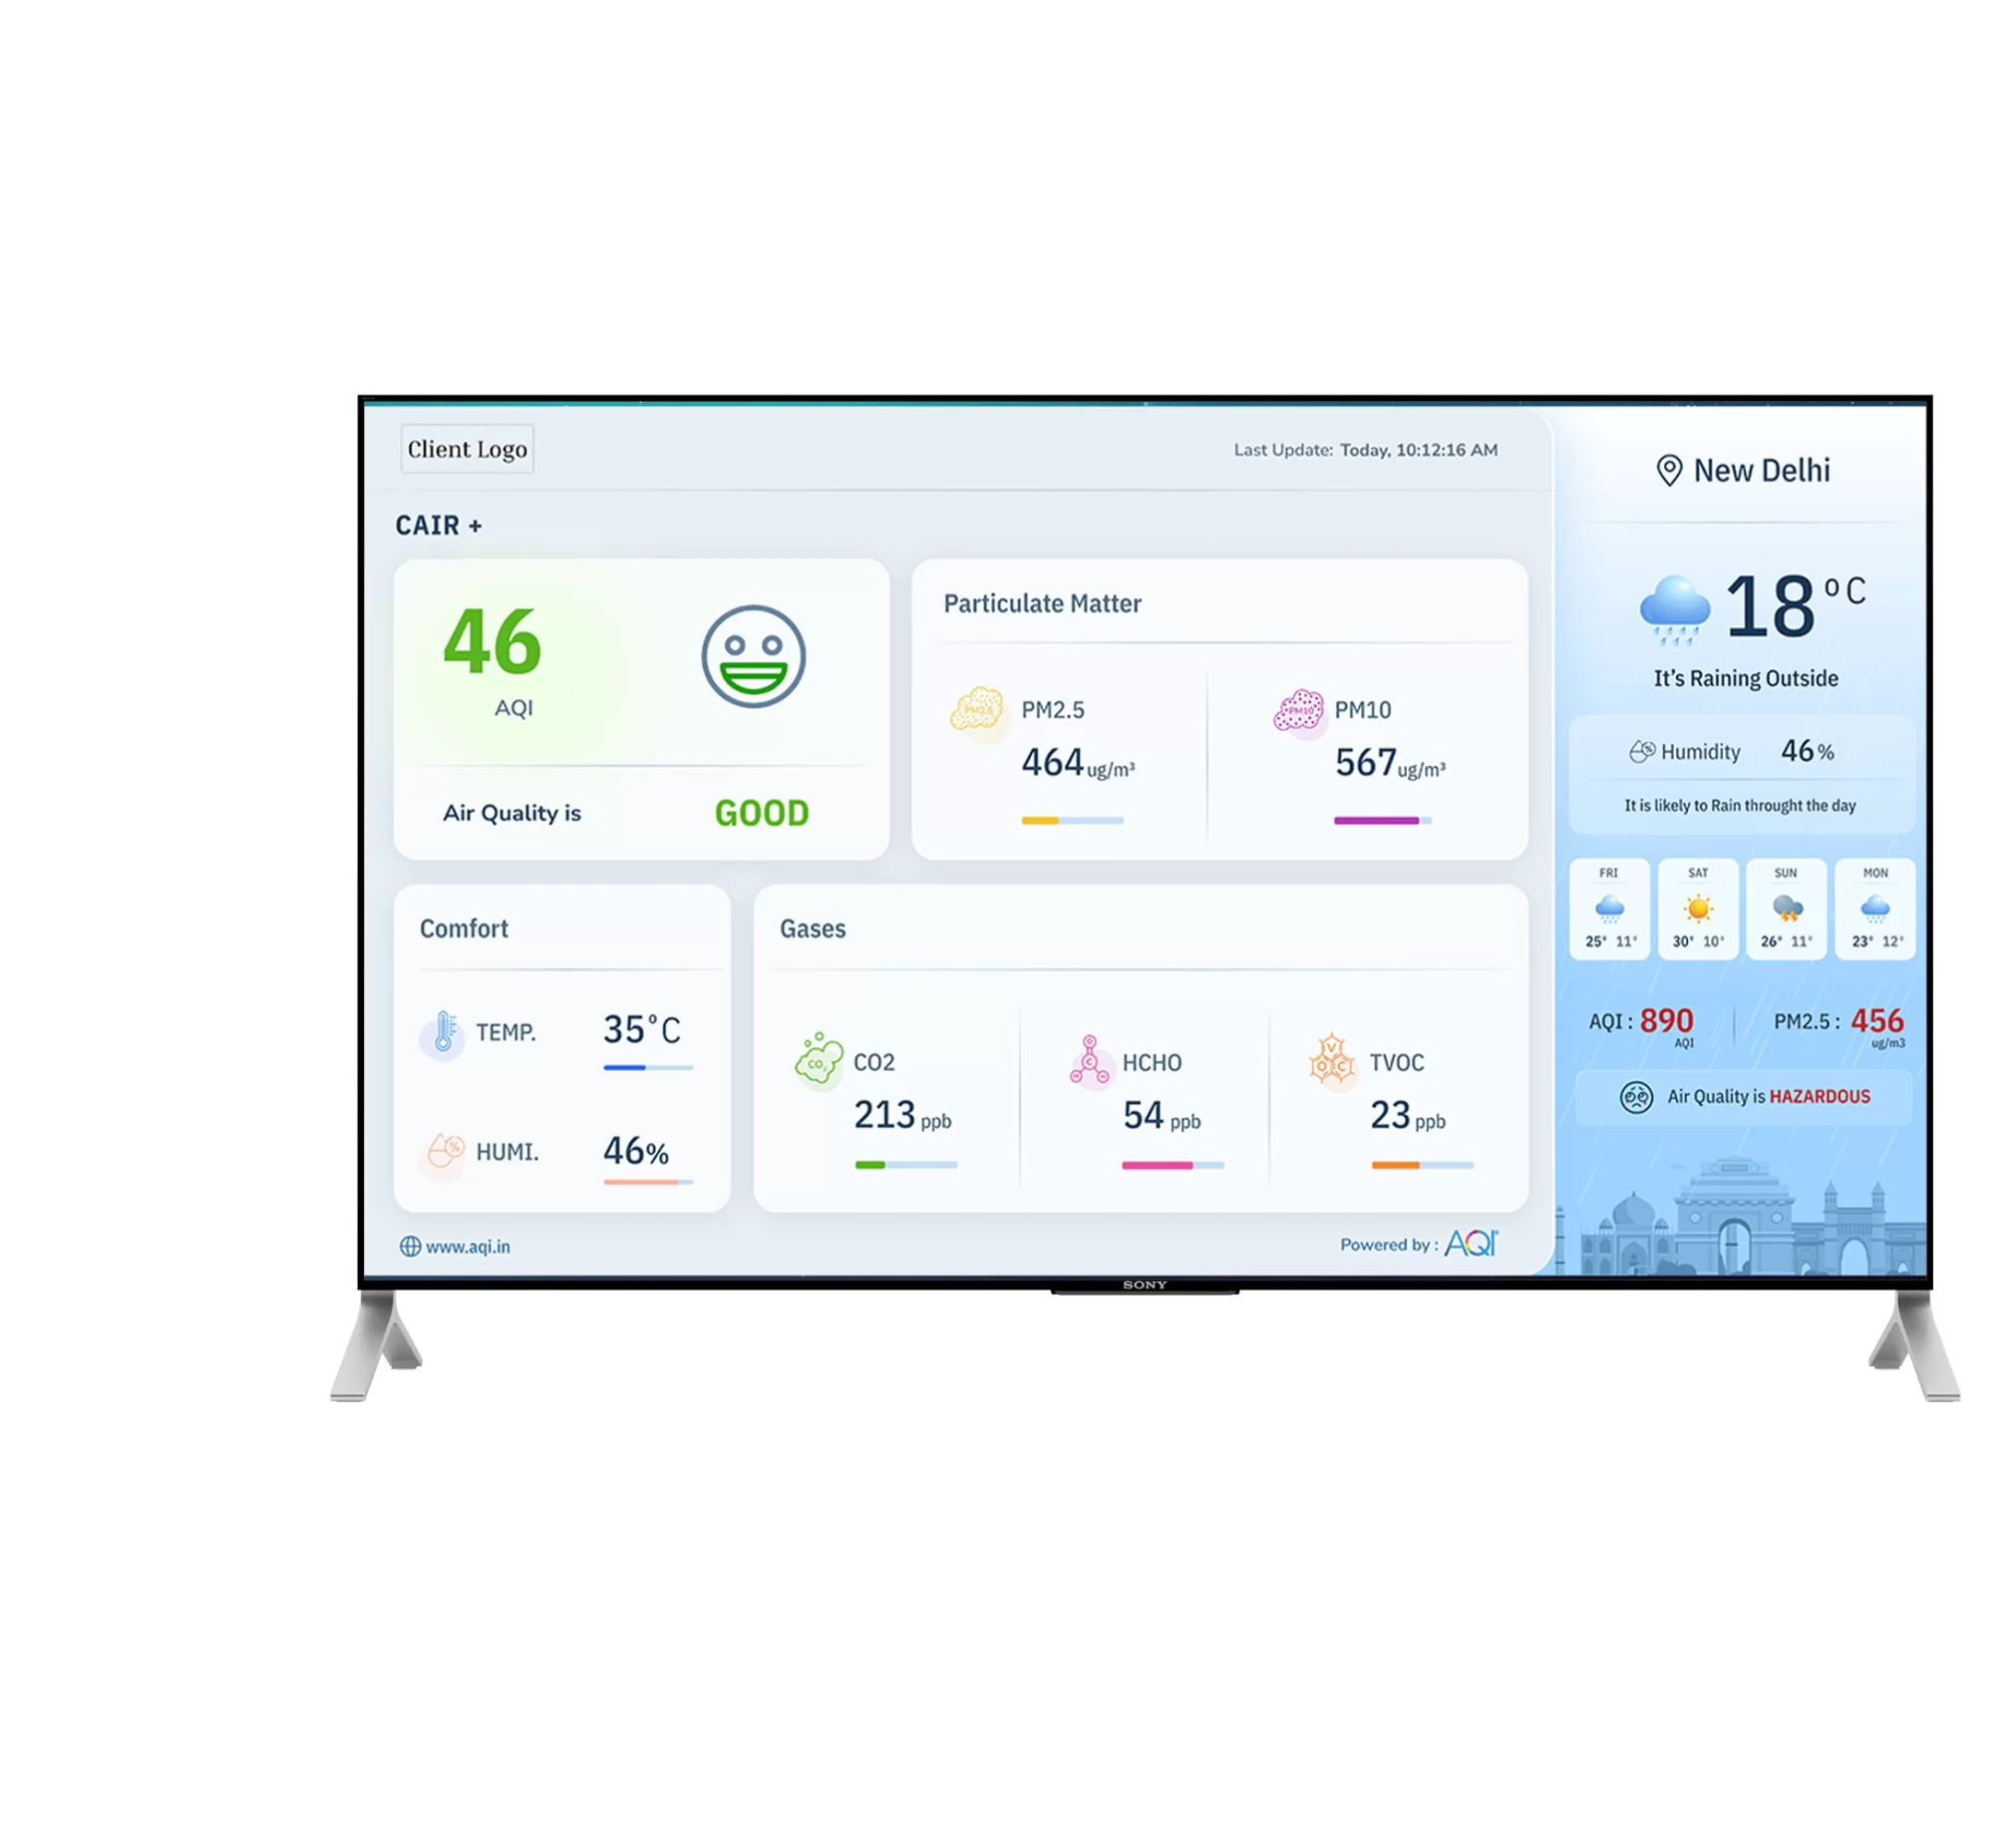
TV Application

Themes variety
Get a variety of theme options to set on your TV for a better and more personalized data showcase.

24*7 data accessibility
Connect your device with the TV app and get 24*7 air quality data on your TV screen.
One-Stop Solution
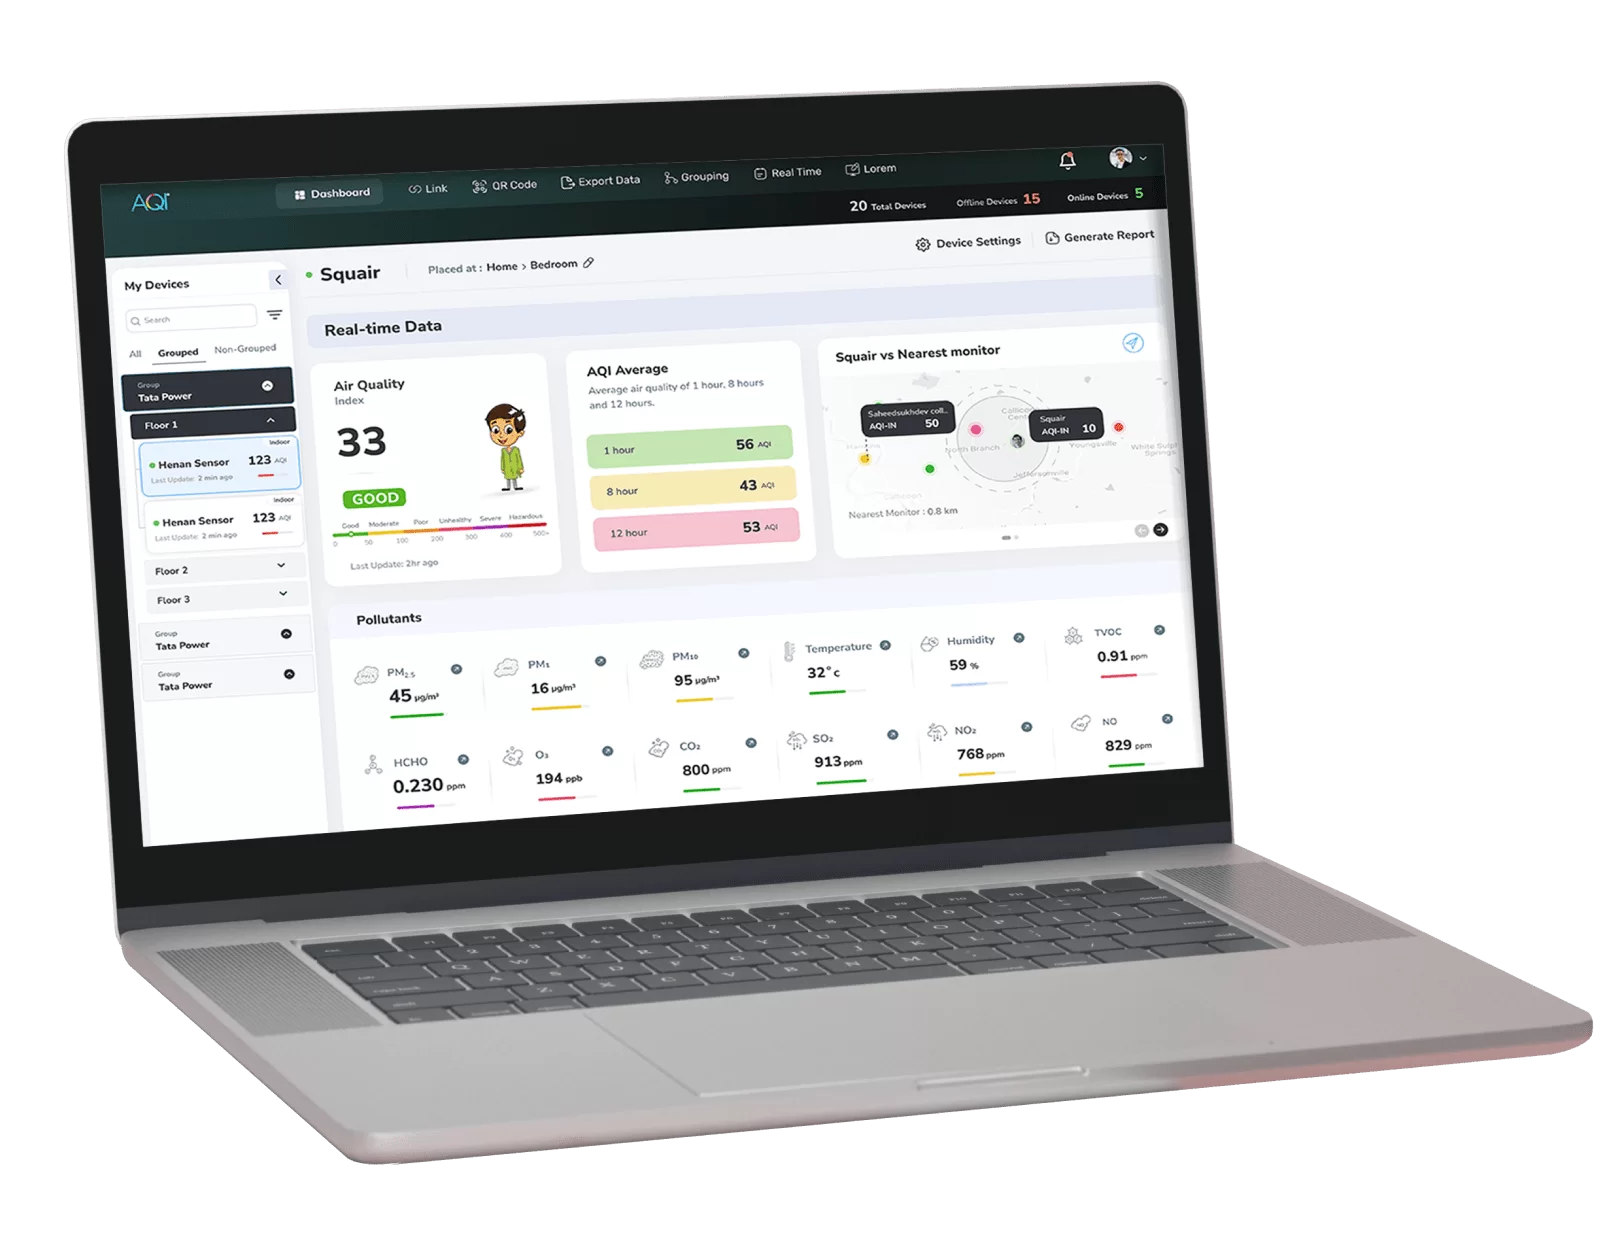
Web Dashboard

Remote Access
Get Real-time and historical air quality, temperature, etc, data anytime and anywhere.

Data comparison
Compare multiple data from outdoor air quality to make informed decisions.
AI CalculatedHealth Index-Score
Get an insight into various scores such as thermal comfort, mold, ventilation, filtration, odor, mites, viruses, etc. Make well-informed decisions to control after monitoring.

Ventilation Score
the provision of fresh air to your room
05
Moderate

Capacity Index
people capacity of the room
02
Good

Mites score
the provision of fresh air to your room
03
Moderate
Virus Index
probability of virus formation in the room
02
Bad
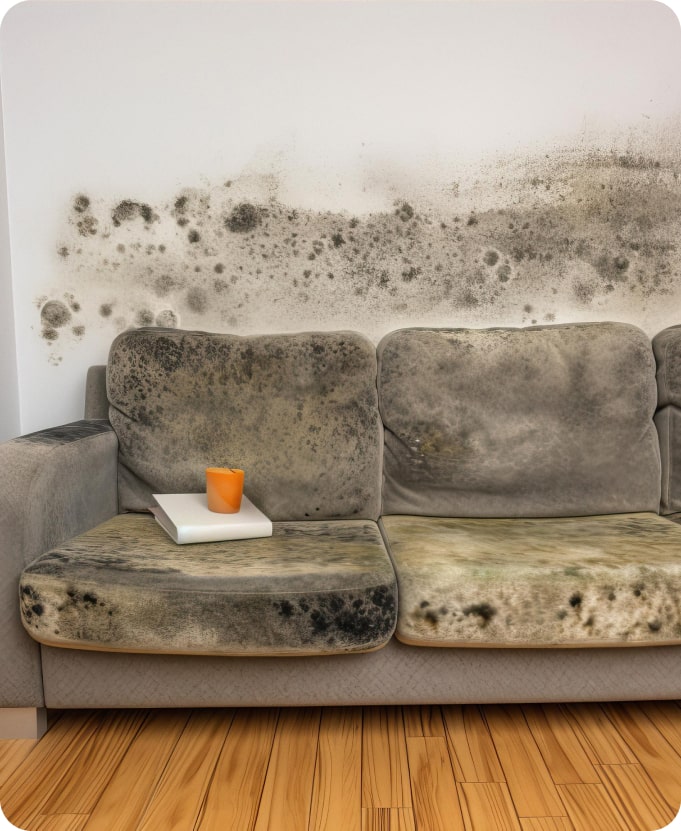
Mold Score
probability of mold formation in the room
02
Bad

Odor score
a distinctive smell in the room
03
Good
Filtration Score
efficiency of filter in the room
03
Moderate

Comfort score
a state of physical ease in the room
04
Bad
Trusted By
Some of the Industry's Top Organisations


According to
 DPCC Guidelines
- 150+
Constructions Sites Covered
Our air quality monitoring devices comply with All Major Standards
Our air quality monitors meet all air quality standards. These standards are just recommended to make them applicable to global solutions. With it, it also supports many air quality management policy alternatives. Check different pollutant parameters in outdoor or indoor air.
- Parameters:
- PM 2.5
- O3
- TVOC
- HCHO
- CO
- WELL:
- 35 µg/m3
- <9 ppm
- <500 µg/m3
- <27 ppb
- <51 ppb
- LEED:
- 15 µg/m3
- 10 ppm
- 500 µg/m3
- 27 ppb
- .075 ppm
- ASHRAE:
- 35 µg/m3
- 11 ppm
- –
- 33 µg/m3
- .075 ppm
- WHO-Europe:
- –
- 10 ppm (8h)
- –
- 0.1 mg/m3
- 0.064 ppm (8h)
- Parameters:
- PM 2.5
- PM 10
- O3
- NO2
- SO2
- Time
- Annual Mean
24-hr Mean. - Annual Mean
24-hr Mean. - 8-hr Mean.
- Annual Mean
1-hr Mean. - 24-hr Mean.
- WHO
- 5 µg/m3
15 µg/m3 - 5 µg/m3
45 µg/m3 - 100 µg/m3
- 10 µg/m3
200 µg/m3 - 40 µg/m3
- India (CPCB)
- 40 µg/m3
60 µg/m3 - 60 µg/m3
100 µg/m3 - 100 µg/m3
- 40 µg/m3
80 µg/m3 (24-hr) - 80 µg/m3
- US (EPA)
- 15 µg/m3
35 µg/m3 - –
150 µg/m3 - 0.070 ppm
- 53 ppb
100 ppb - 75 ppb (1-hr)
- European (EEA)
- Limit value, 25 µg/m3
– - Limit value, 40 µg/m3
Limit value, 50 µg/m3 (1-hr) - Target value, 120µg/m3
- 40 µg/m3
Limit value, 200 µg/m3 - –
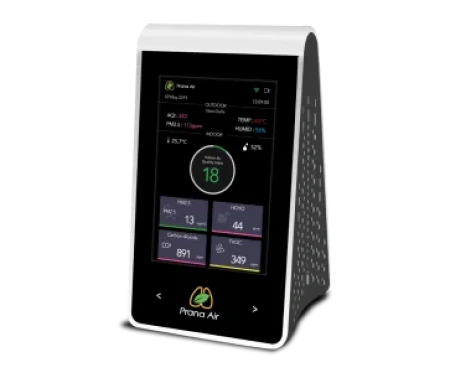
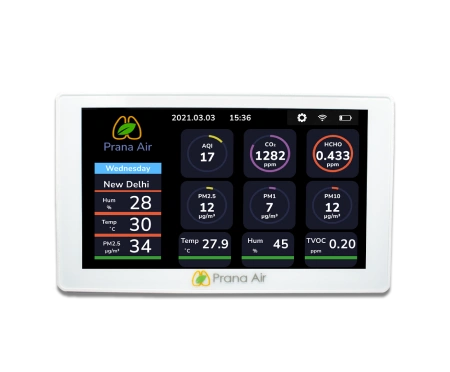
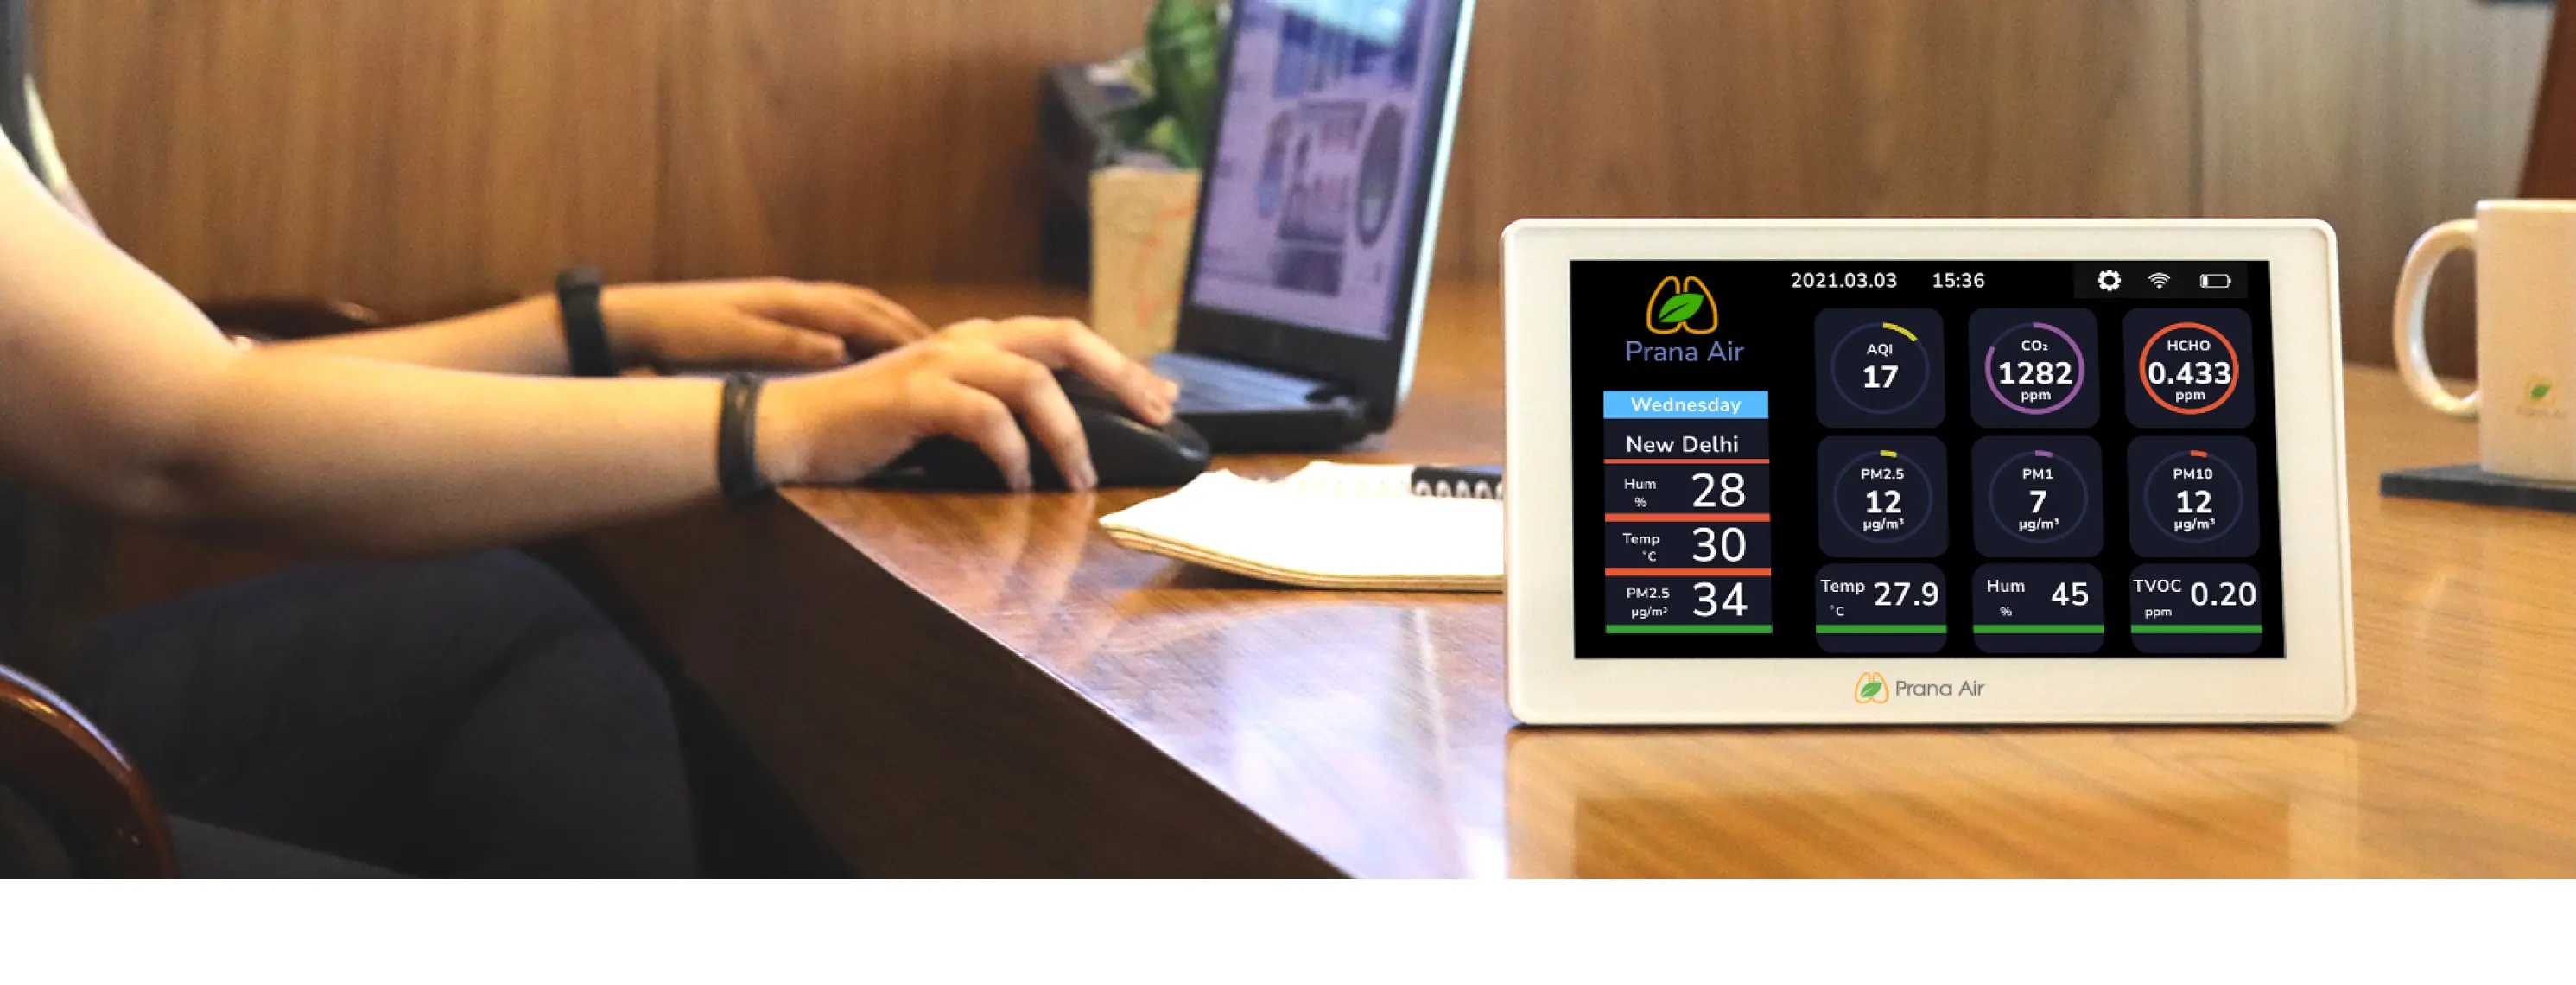
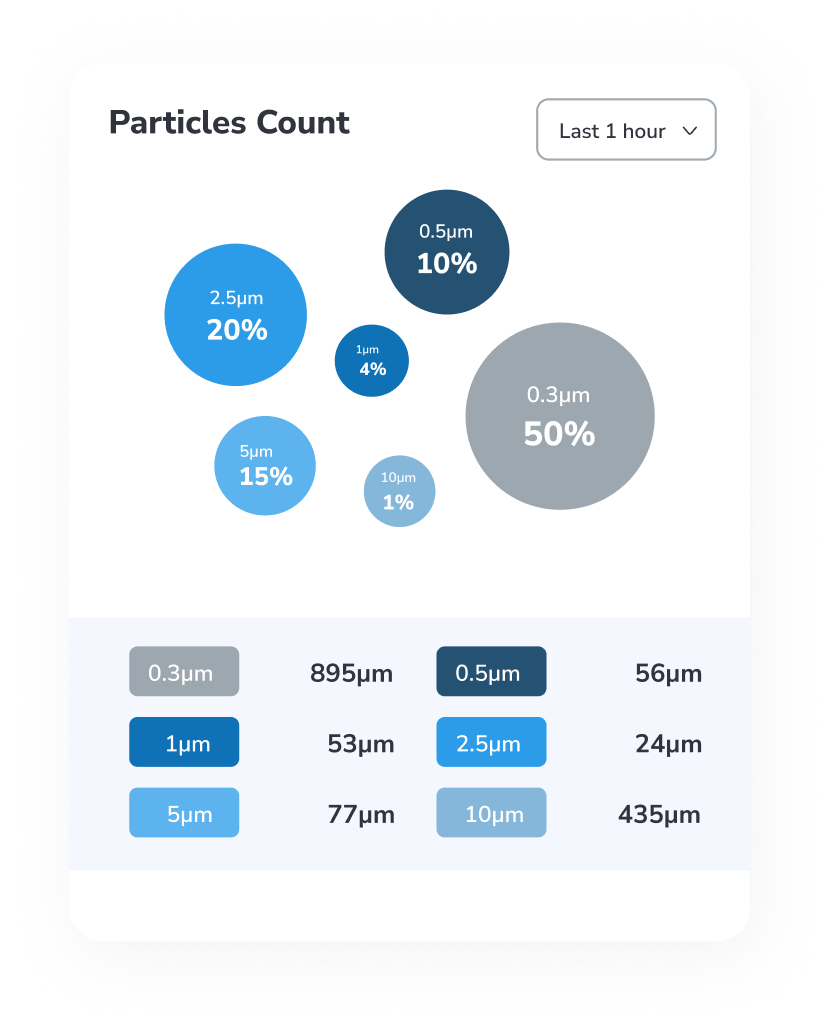
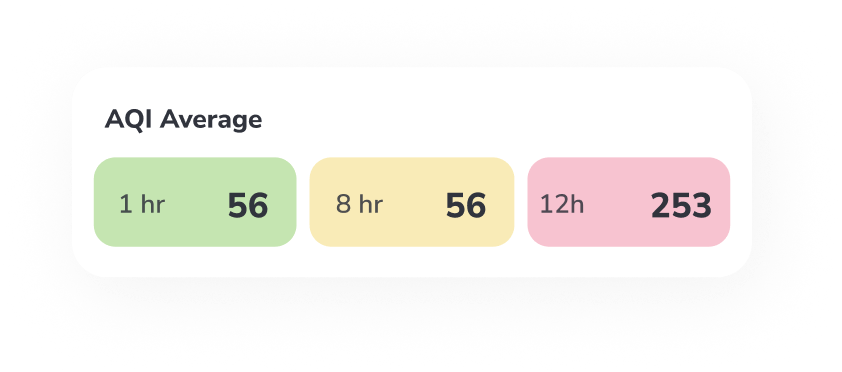
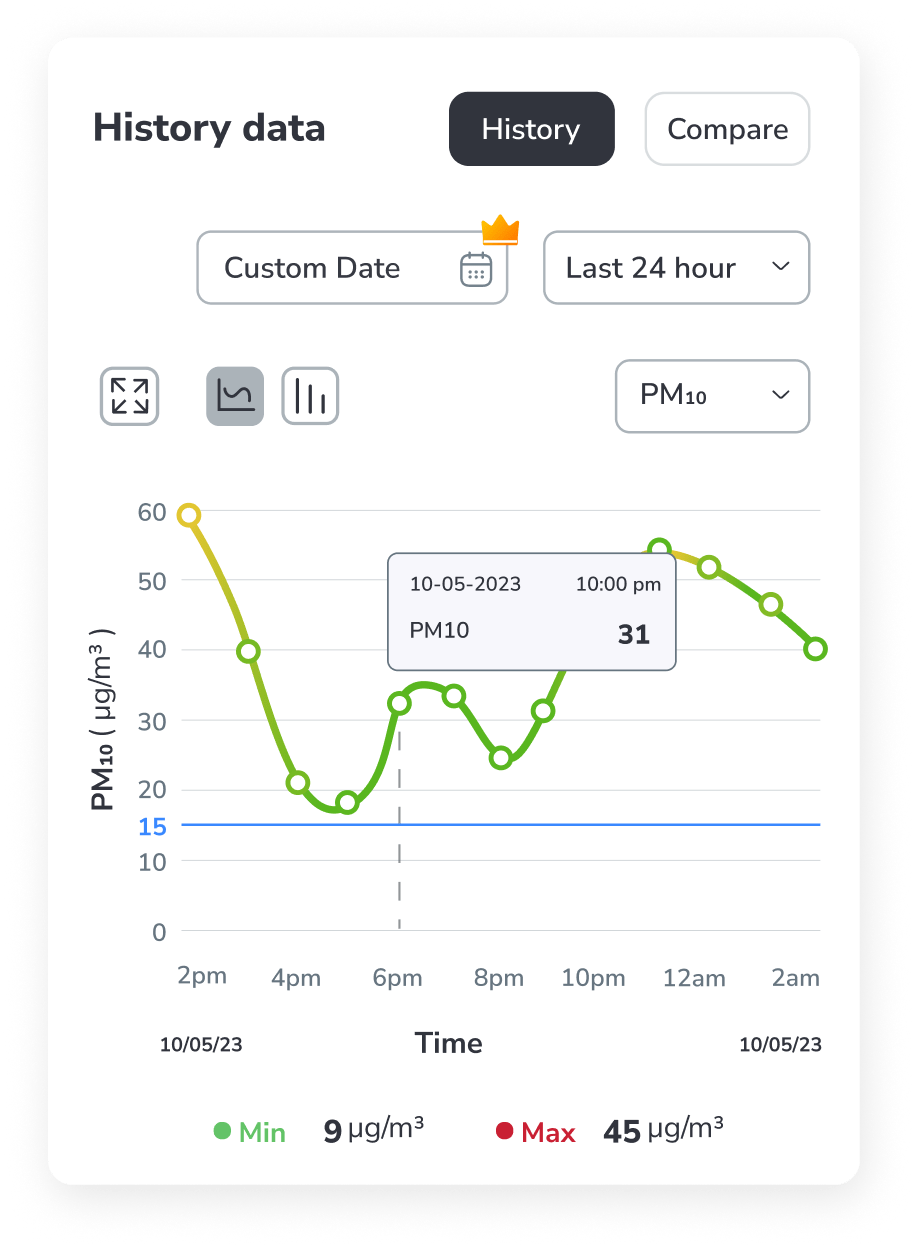
Air Quality Data Insight on your TV or Web Dashboard
Connect your device with a TV or Web Dashboard. As to showcase various sights for air quality monitoring on a big screen. As you can see the individual pollutant in the air. With it, it also displays the historical data to determine past exposure. You can also check the pollutant summary for the last 24 hours and the filtration score.
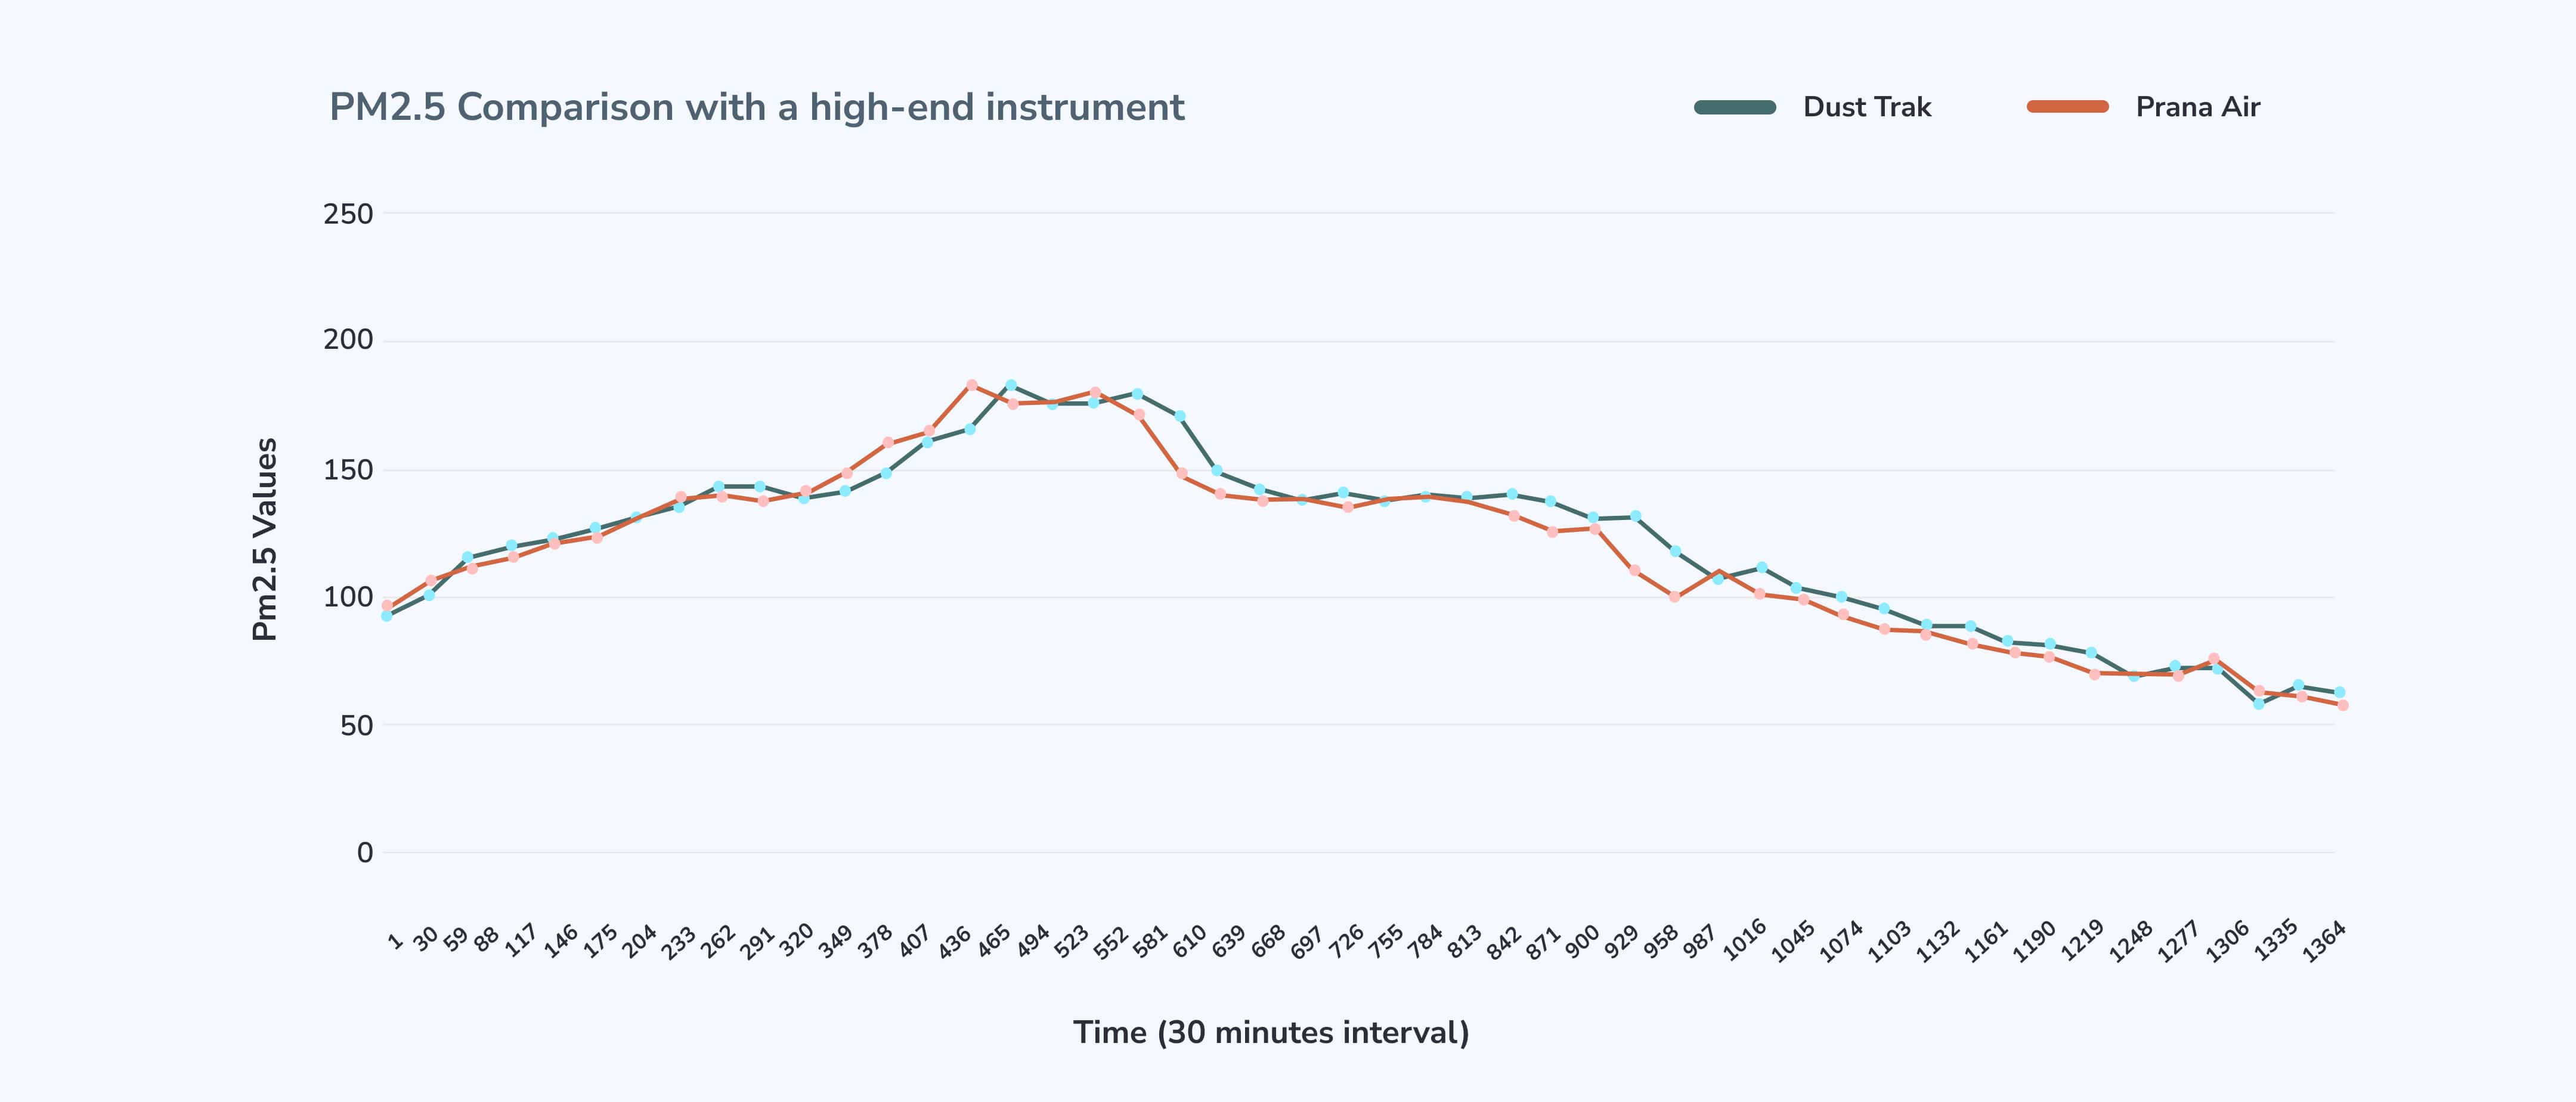
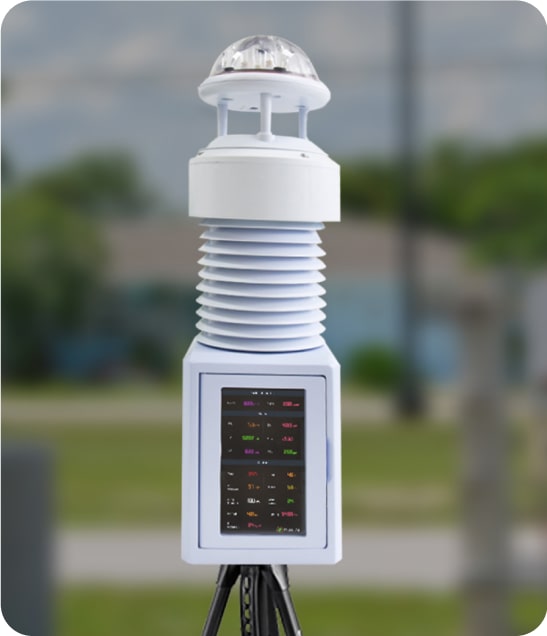
Highly Accurate Prana Air Monitor
PM2.5 correlation with a high-end instrument
We care about customer experience too
Some Reviews of Our Customers
Get in Touch
Please help us know what requirements you have. Our team will contact you very soon.
Contact Info
Looking for Any Indoor Air Quality Monitor?
Phone:
(+91) 73918-73918
Email:
info@purelogic.in
Office:
706, 7th Floor, Sec 10, Rohini, Delhi 85, India
You may also like
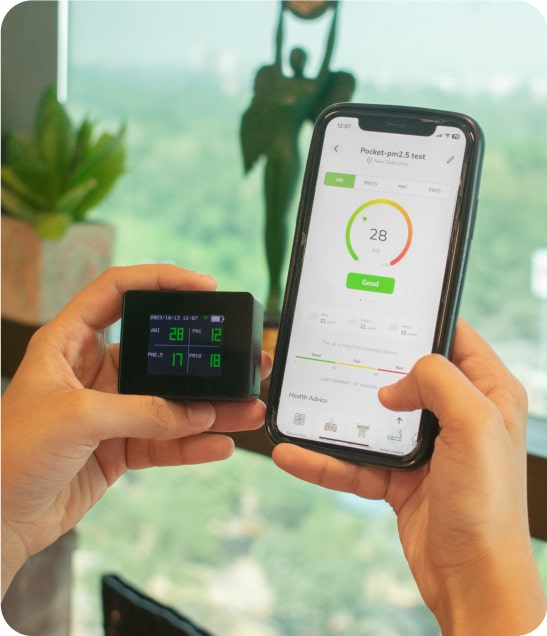
Pocket PM

Cair+
Sensible
Ambient pro
SQUAIR